NESTA
Infographics for report on job transitions and skills policy

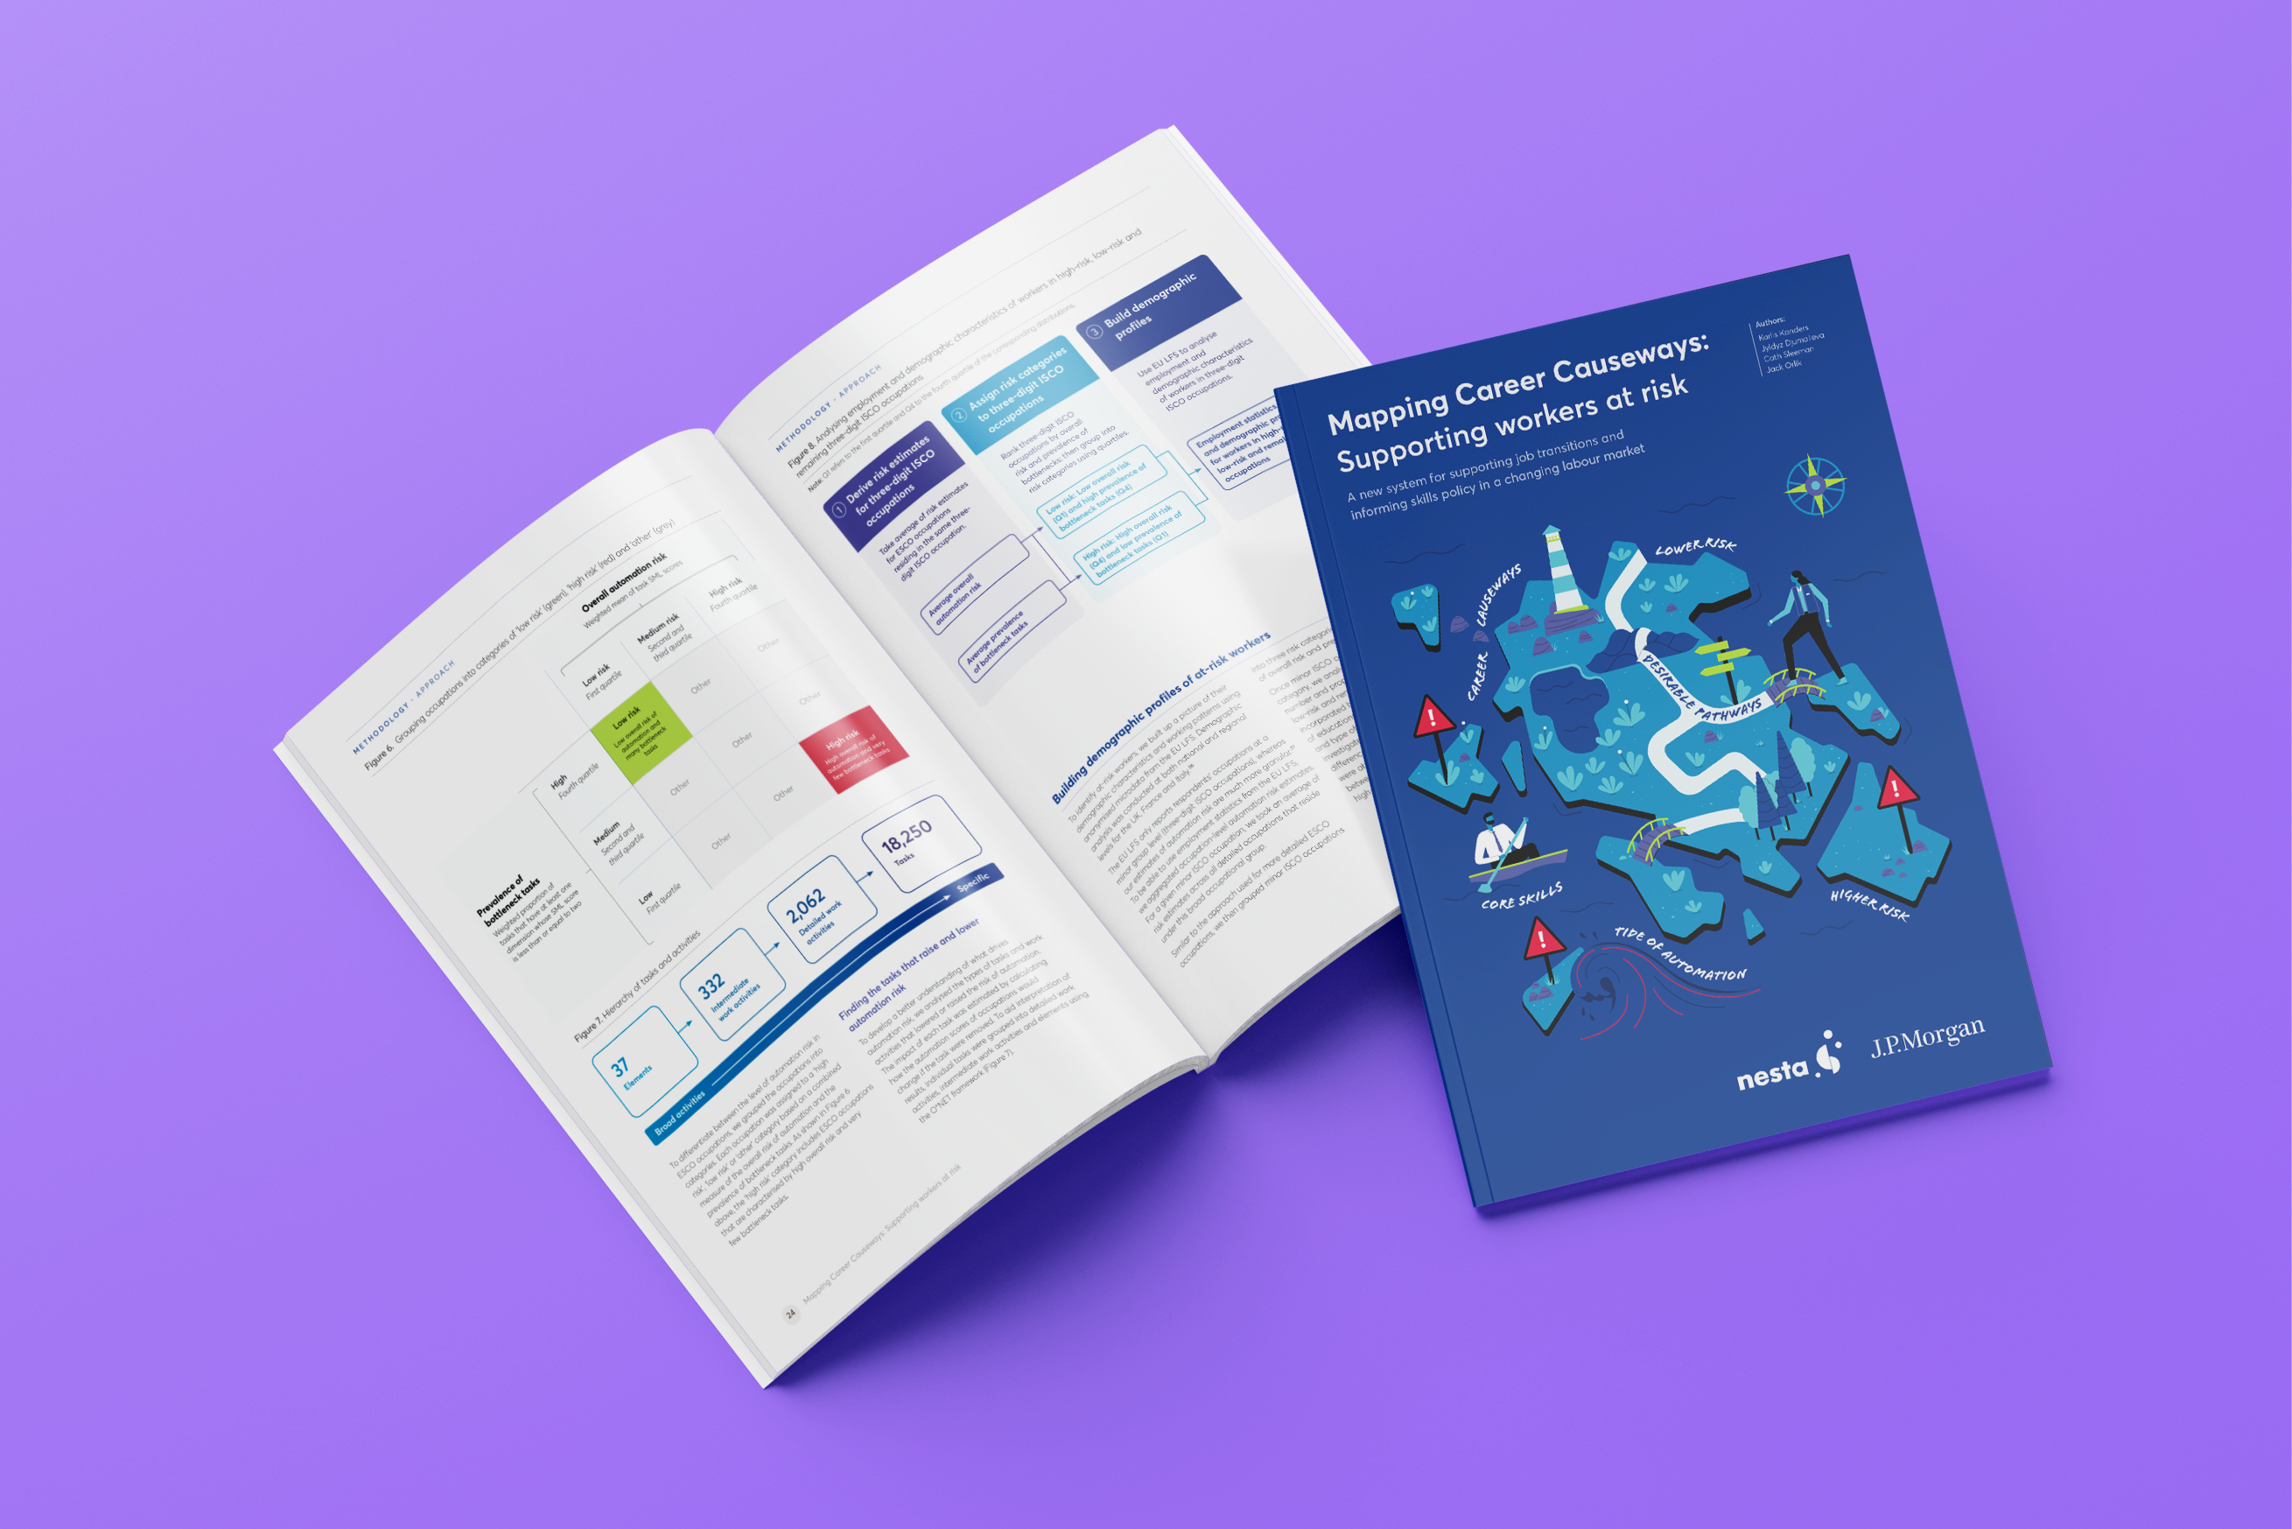
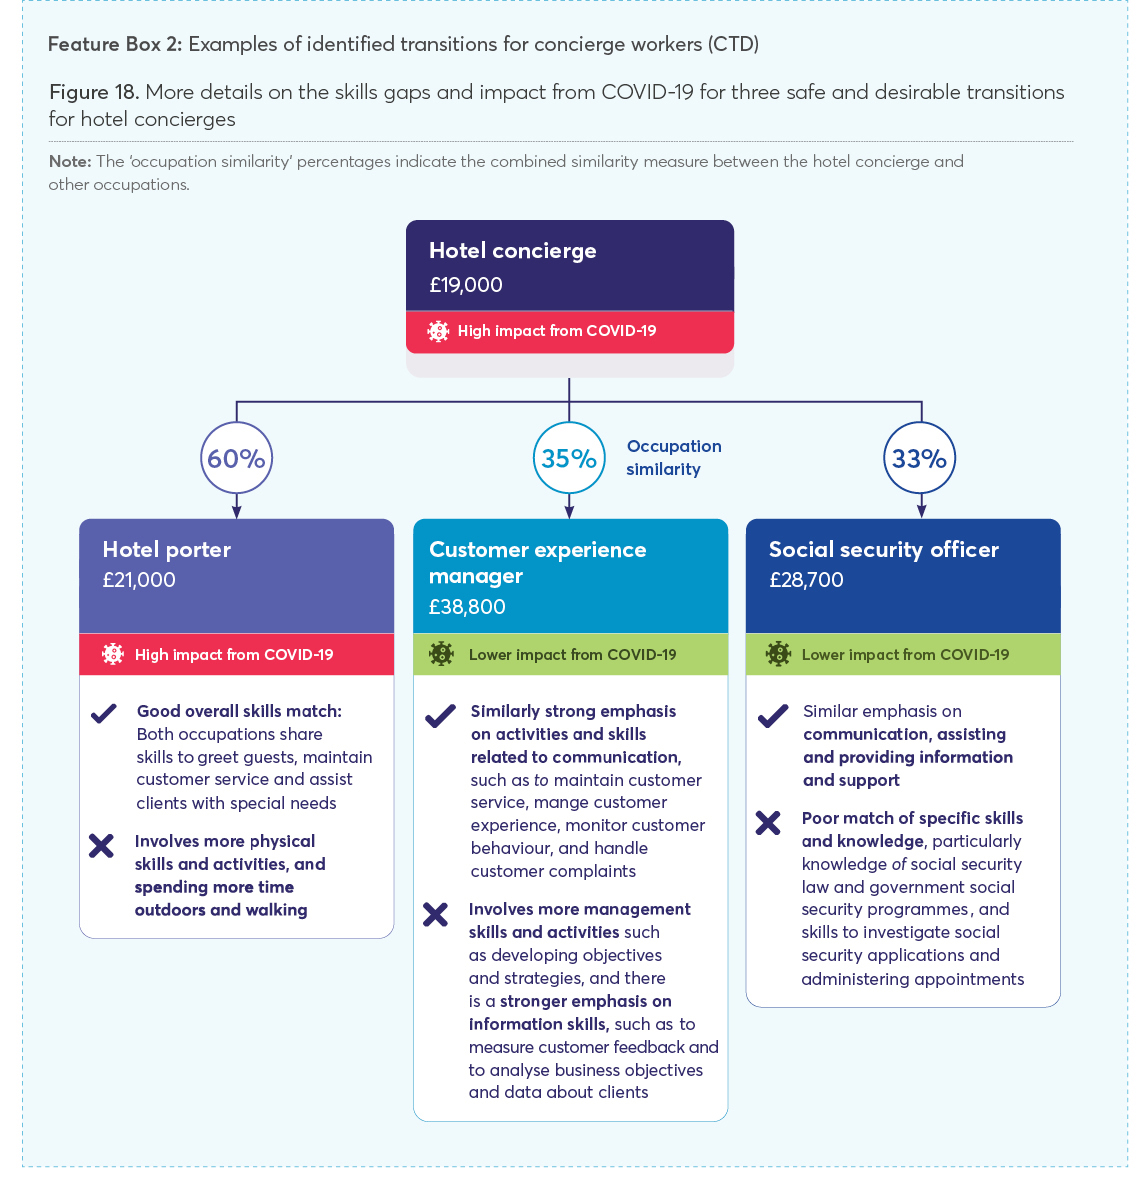
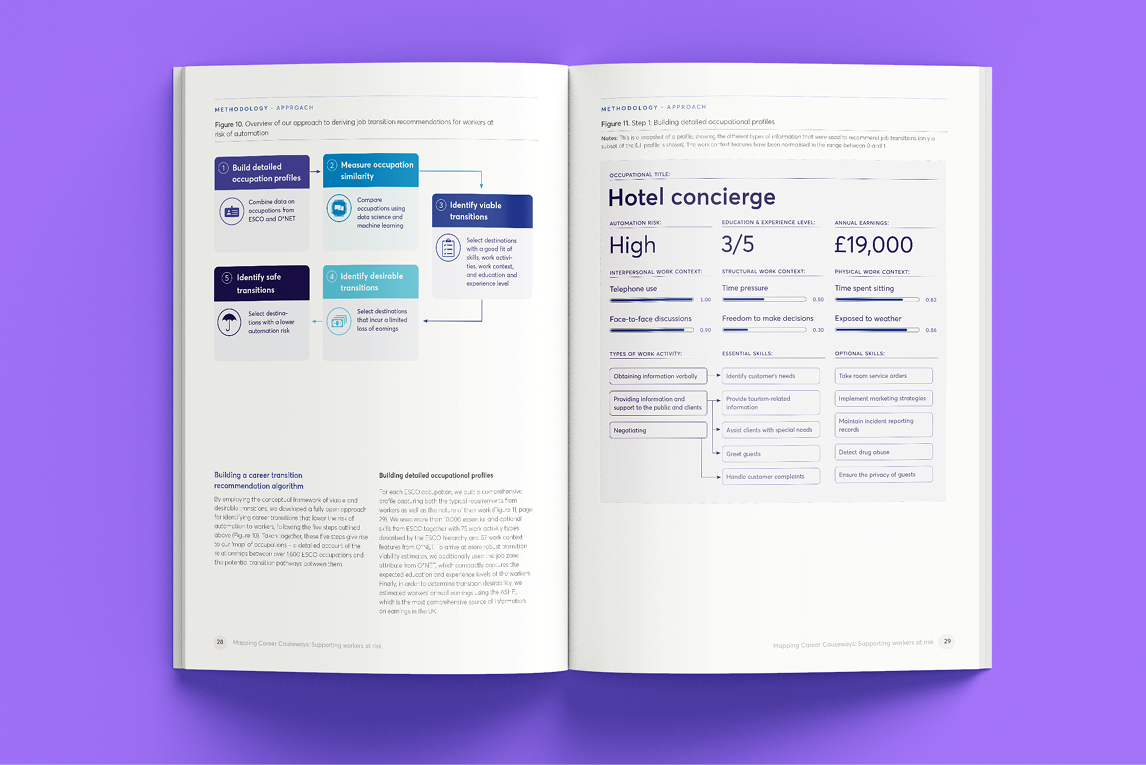
The pandemic has wreaked havoc on labour markets, throwing into sharp relief a lack of timely careers advice. NESTA’s report aims to fill that information gap by pinpointing the transferable skills potential of workers in displaced sectors (retail, hospitality and leisure) to help unlock new career paths. The guidance is made possible by an algorithm that estimates the similarity between over 1,600 jobs, based on the skills and work experiences required in each role.
What did I do?
I was tasked by Festoon Studios to create a clear and attractive visualisation of the findings, communicated in over fifty infographic figures. Each figure needed to align with the NESTA brand and be immediately understandable for key policy makers in government, careers advisors and employers.
My approach
Working closely with the founder of Festoon Studios, we built out the infographics with a visually arresting colour palette that helps readers to easily understand and compare critical data findings. A tailored symbol set adds context and humanity without sacrificing statistical information.
By asking critical questions and iterating on the source content, we made informed conjectures about the presentation of each infographic figure. Many figures would have seemed arcane to those not closely involved in world of data science. I designed the information in a way that guides the user narrative, optimises space constraints and communicates with a clear, lively approach.


Key outputs
NESTA has published a sophisticated, professional and information-rich report that articulates their findings clearly. By reframing obscure figures with added clarity, we brought attention to insights hiding in the data that may have otherwise been glossed over or ignored.


